
Blog
What is An Audiogram And How To Read It
Wondering how to read an audiogram? Learn what an audiogram is, how hearing tests work, what the symbols mean, and how to understand your results.

Matt Sherman



Inside a modern clinic, a grey haired man wearing headphones holds a clicker as a woman in a lab coat sits behind a glass window. The room has noise dampening foam padding. The setting suggests a medical facility specializing in audiology
If you’ve ever had a hearing test and been handed a chart full of X’s, O’s, and a jagged line going downhill - this guide is for you! It looks more complicated than it is. And once you know how to read it, it tells you a lot. Here’s everything you actually need to know: what an audiogram is, how the test works, how to make sense of your results, and whether you even need one.
What is An Audiogram?
An audiogram is a graph of your hearing. It maps out the softest sounds you can detect across a range of pitches from a process called audiometry, helping you visualize your unique hearing ability. It is the standard chart used by audiologists worldwide to document how well each ear detects sound across a range of pitches and volumes.
The audiogram has two axes: frequency (measured in Hertz) on the x-axis and volume or sound intensity (measured in decibels) on the y-axis. Your hearing thresholds for each frequency are plotted as symbols on the graph, typically using different colors or shapes to represent each ear.
A hearing test depicts your ability to perceive sounds based on their frequency (high-pitched versus low-pitched) and volume, indicating their loudness.
Understanding the measurement of sound in an audiogram can be simplified by relating it to everyday examples. Here are a few comparisons:
- Low-Frequency Sound: Refrigerator hum or the rumble of a distant thunderstorm.
- High-Frequency Sound: Birds chirping or the tinkling sound of a wind chime. These higher frequencies are often the first to be affected when hearing loss develops.
- Soft Sounds: Leaves rustling or the whisper of a gentle breeze.
- Loud Sounds: Booming fireworks or the roar of a jet engine.
By presenting results for each ear, the audiogram results inform the audiologist about the faintest sound you can detect at specific frequencies. Thus, painting a clear picture of your unique hearing capabilities.
How Does An Audiogram Work?
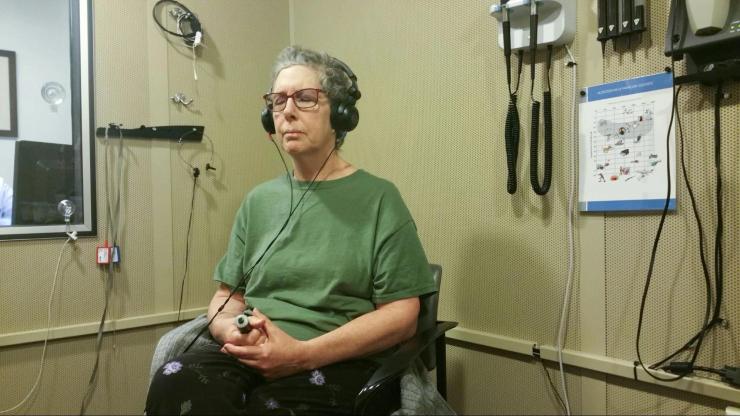
Woman sitting with headsets and holding a button during an audiogram.
During an audiogram, you will sit in a quiet space and wear headphones connected to an audiometer, a specialized device that generates sounds of various frequencies and volumes. The audiologist or hearing care specialist will also have a control panel to adjust the settings.
The test typically begins with pure-tone testing, in which a series of beeps are played at different frequencies in one ear at a time, ranging from low to high. Each frequency corresponds to a specific pitch of sound. This is the most common method used in a basic hearing screening as well as a full diagnostic evaluation.
Next, you will raise your hand or press a button when you hear a tone, helping the audiologist determine the softest sound you can hear at each frequency.
Air Conduction vs. Bone Conduction Testing
A complete audiogram usually includes two different methods of measuring hearing:
- Air conduction testing: Sounds are delivered through headphones or earphones and travel through the outer ear, ear canal, eardrum, middle ear, and finally to the inner ear. This tests the full hearing pathway.
- Bone conduction testing: A small vibrating device is placed behind your ear on the mastoid bone. The vibrations bypass the outer and middle ear, sending sound directly to the inner ear through bone conduction. This helps the audiologist pinpoint where in the hearing system a problem may be occurring.
Comparing the results from air and bone conduction tests reveals the air-bone gap, which is the difference between the two thresholds. A significant air-bone gap usually indicates a problem in the outer or middle ear, while equally reduced air and bone conduction thresholds suggest the issue lies in the inner ear.
After assessing your hearing at different frequencies, the audiometer will present tones at a fixed frequency (usually around 1,000 Hz) and gradually increase their volume. This step helps determine your discomfort or pain threshold, known as the uncomfortable loudness level.
Then, the audiologist records your responses on an audiogram to interpret the results and make recommendations accordingly. Don't worry; the hearing test is painless and risk-free.
How To Interpret An Audiogram
Understanding and interpreting an audiogram is easier than you might think!
An audiogram uses specific symbols to represent various frequencies and volume levels. Sounds fall within different areas of the audiogram chart depending on their frequency and volume.
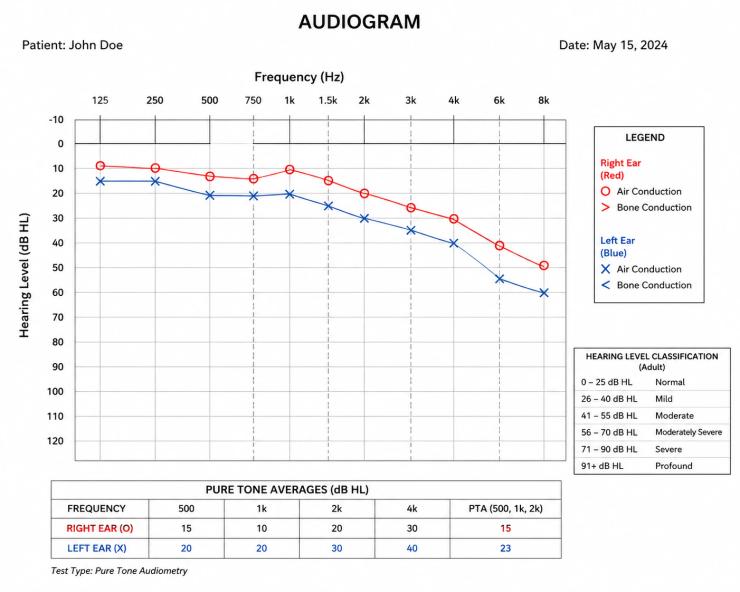
Audiogram chart showing hearing test results for both ears across different sound frequencies and hearing levels.
Let's explore how to decipher these symbols and make sense of your audiogram results.
- Frequency Axis (x-axis): On the horizontal axis of the audiogram, you will find the frequency measured in Hertz (Hz). The frequency represents the pitch of the sounds, ranging from low-pitched sounds on the left side to high-pitched sounds on the right side of the graph.
- Volume Axis (y-axis): The vertical axis of the audiogram represents intensity measured in decibels (dB). Intensity indicates the loudness of sounds, with softer sounds at the top and louder sounds at the bottom of the graph.
- X and O Symbols: X and O symbols are commonly used on the audiogram to represent the air conduction thresholds for the right ear (X) and the left ear (O). These symbols indicate the softest sounds you can hear at different frequencies. The closer the symbol is to the top of the graph, the better your hearing at that frequency; the lower the symbol, the greater the hearing loss.
- Bone Conduction Symbols: Brackets (< for the right ear, > for the left ear) are typically used to represent bone conduction thresholds, allowing your audiologist to compare them against the air conduction results.
- Audiogram Markings: Audiologists use various markings on the graph to denote specific hearing levels and identify patterns of hearing loss.
Degrees of Hearing Loss
The severity of hearing loss is categorized into degrees, ranging from mild to profound. The audiogram will typically include key thresholds to determine the degree of hearing loss, such as:
- Normal hearing (0-25 dB): Indicates no significant hearing loss.
- Mild hearing loss (26-40 dB): Slight difficulty hearing softer sounds or speech in noisy environments.
- Moderate hearing loss (41-55 dB): Difficulty hearing normal conversation without amplification.
- Moderately severe (56-70 dB): Difficulty hearing speech, even with raised voices.
- Severe (71-90 dB): Limited ability to hear speech without amplification.
- Profound hearing loss (91+ dB): Extreme difficulty or inability to hear speech, even with amplification.
Type of Hearing Loss
An audiogram doesn't just measure how much hearing loss you have — it also helps identify the type of hearing loss, which determines the most effective treatment path:
- Conductive hearing loss: Caused by problems in the outer or middle ear that prevent sound from being conducted efficiently to the inner ear. Common causes include ear infections, fluid buildup, earwax blockages, or otosclerosis (abnormal bone growth in the middle ear). On an audiogram, conductive hearing loss shows normal bone conduction with reduced air conduction, creating a visible air-bone gap.
- Sensorineural hearing loss: Caused by damage to the inner ear (cochlea) or the auditory nerve. This is the most common type of permanent hearing loss and often results from aging, noise exposure, or genetics. On the audiogram, both air and bone conduction thresholds are reduced equally, with no air-bone gap.
- Mixed hearing loss: A combination of both conductive and sensorineural hearing loss, meaning there are issues in both the outer/middle ear and the inner ear. The audiogram shows reduced bone conduction with an additional air-bone gap.
Patterns of Hearing Loss
The shape of the line connecting your audiogram symbols also tells a story:
- High-frequency hearing loss: Thresholds drop off in the higher frequencies (typically above 2,000 Hz), making it hard to hear consonants like "s," "f," and "th." This is the most common pattern, especially with age-related and noise-induced hearing loss.
- Low-frequency hearing loss: Thresholds are worse in the lower frequencies, making deep voices and bass sounds harder to hear.
- Flat hearing loss: Thresholds are reduced fairly evenly across all frequencies.
By examining the placement of symbols and markings on the audiogram, you can better understand your hearing abilities and the extent of any hearing loss you may have. Consult with an audiologist or hearing care professional to accurately interpret your audiogram and discuss suitable treatment options, such as hearing aids, cochlear implants, or other interventions.
Who Needs An Audiogram?
An audiogram can provide valuable insights into your hearing health and overall well-being.
Here are 6 reasons why you should consider getting an audiogram:
- Identify Hearing Loss: An audiogram is the most effective way to diagnose hearing loss. By undergoing a hearing evaluation and obtaining an audiogram, you can determine if you have any degree of hearing loss and understand the type of hearing loss you have (conductive, sensorineural, or mixed).
- Early Detection: Regular audiograms and routine hearing screenings can help in the early detection of hearing problems. Identifying hearing loss at an early stage allows for timely intervention and management, which can significantly improve outcomes and quality of life. This is especially important for catching age-related hearing loss, also known as presbycusis, which develops gradually and is easy to overlook.
- Establish Baseline: An initial audiogram serves as a baseline measurement of your hearing abilities. It provides a reference point against which future audiograms can be compared, helping to monitor any changes in your hearing over time.
- Personalized Treatment: An audiogram provides valuable information that can guide the development of a personalized treatment plan. Based on the specific results of your audiogram, recommendations can be made for hearing aids, cochlear implants, assistive listening devices, communication strategies, or other interventions tailored to your unique needs.
- Overall Health Awareness: Hearing loss is not just an isolated condition; it can be linked to various underlying health issues. By getting an audiogram, you can gain awareness of any potential health concerns associated with hearing loss, such as cardiovascular disease, diabetes, or neurological conditions.
- Lifestyle Improvement: Addressing hearing loss through appropriate interventions can significantly enhance your quality of life. Improved communication, better social interactions, increased cognitive abilities, and overall well-being are among the benefits that can result from managing hearing loss effectively.
Are you preparing for an audiogram test? Here's what to expect and some of the most common questions answered:
How Long Does An Audiogram Take?
An audiogram hearing test is minimally invasive and painless. The hearing test takes 20 to 30 minutes, and the audiologist will review the results with you.
How Accurate is An Audiogram?
An audiogram is considered the gold standard in hearing tests and is highly accurate because of the extensive testing and categorizations for hearing loss. Combining pure-tone audiometry with bone conduction testing gives audiologists a complete picture of both how well you hear and where in the auditory system any issues may be occurring.
What Are Normal Audiogram Levels?
Normal hearing levels are between zero and 25 dB across all frequencies.
The mild hearing loss threshold is between 26-40 dB. The sound of a whisper is about 30 dB, and the sound of a normal conversation is about 60 dB, so most people with mild hearing loss need to ask others to repeat themselves often.
Moderate hearing loss falls between 41-55 dB, while severe hearing loss has a threshold between 71-90 dB, making most everyday speech inaudible without amplification. Profound hearing loss (91+ dB) means even very loud sounds may be difficult or impossible to hear without significant intervention.
What is the 'Speech Banana'?
"Speech banana" describes the area where most sounds of average conversational speech occur on the audiogram. Because the area resembles the shape of a banana, audiologists refer to these sounds as the speech banana.
For example, different speech sounds have different pitches or volumes. Consonant sounds (words with T, S, B, G, H, X, J, K, etc.) are more high-pitched and low in volume, and vowel sounds (words with E, A, O, U, I) are low-pitched and low to medium volume. When you can hear both the vowels and consonants of words, it's easier to follow a conversation. This is especially important to consider in children beginning to develop speech.
Can An Audiogram Detect Tinnitus?
Tinnitus is a perception of sound without an external stimulus, often described as ringing, buzzing, or hissing in the ears. This sensation varies from person to person.
During an audiogram, the primary focus is on measuring and evaluating your hearing sensitivity across different frequencies and intensity levels. Tinnitus, however, does not necessarily correlate with specific patterns on an audiogram, as it is not solely related to hearing loss.
However, an audiogram can still provide some insights indirectly related to tinnitus. For example, it can identify if there is any hearing loss that might contribute to the perception of tinnitus. Additionally, specific tests conducted during the audiogram, such as pitch matching and loudness discomfort levels, may help assess tinnitus's characteristics and severity.
What is The Difference Between A Hearing Screening And An Audiogram?
A hearing screening is a quick pass/fail test that simply checks whether your hearing falls within a normal range. It is commonly used in schools, workplaces, and routine doctor visits to flag people who may need further evaluation.
A full audiogram, on the other hand, is a comprehensive diagnostic test that maps your hearing thresholds across multiple frequencies and includes both air conduction testing and bone conduction testing. If a screening suggests possible hearing loss, an audiogram is the next step.
Conclusion
Now that you know what to expect during a hearing test, interpreting your hearing test results becomes much easier and less intimidating. From understanding the x-axis and y-axis to recognizing the difference between conductive, sensorineural, and mixed hearing loss, you now have the tools to make sense of what your audiogram is showing. Just think of a hearing test as a friendly tool to uncover your hearing abilities, improve your overall hearing health, and enhance your everyday life.
Matt Sherman Matt is the Head of Community at Rylo, where he serves as a bridge between the company and its community, working to identify accessibility needs and break down communication barriers. He leads conferences, partnerships, strategic initiatives, and advocacy efforts, while also nurturing Rylo’s online and offline communities to keep them thriving and growing every day. Outside of work, Matt is an avid outdoorsman who enjoys fishing and exploring the serenity of Minnesota’s land of 10,000 lakes.
Read next

How to Call a Deaf Person on the Phone: The Complete 2026 Guide
Need to call a deaf person on the phone? Learn how 711 relay services, VRS, captioned phones, and apps like Nagish make communication simple in 2026.
June 12, 2026

How to Know If You're Going Deaf in One Ear: Common Signs, Causes, and What to Do Next
Wondering if you're going deaf in one ear? Learn the early signs of single-sided hearing loss, common causes, when it's an emergency, and what to do next.
June 11, 2026

How to Sign "Deaf" in ASL
Want to learn how to sign "deaf" in ASL? Follow step-by-step instructions, see accepted variations, avoid common mistakes, and understand Deaf culture.
June 11, 2026